Carolingian Networks takes a dynamic view of the late 8th and early 9th Century, a period usually referred to as the Carolingian Renaissance, by exploring the relationship among intellectuals (authors, teachers, students) and their written works. By following the distribution of specific manuscripts and letters, themes and patterns emerge that give a better understanding of the time period and the impact these writings had. The goal is to make Carolingian Intellectual Networks available online so other scholars can explore the data and continuously add to it – thus leading to new discoveries and new paths of research.
In the age of Facebook, Twitter, LinkedIn, and other global social networking tools, networks and ways in which we can (re)construct and analyze them have become an important focus of research across the disciplines. This is no less true for those of us studying the premodern world, where networks (whether social, political, familial or intellectual) were both the fabric and the driving force of societies.
By interrogating recent scholarship on early medieval intellectuals and their networks, Professor Woods demonstrates the limits of text-based network studies, and argues that we cannot gain a fully nuanced and accurate understanding of early medieval intellectual networks unless we use new digital tools to visualize our data. The very process of visualization enables–even requires–us to ask different and larger questions of our sources. Visual models handle complex data more effectively than text-based narratives: layering different sorts of network — correspondence, travel itineraries, manuscript distribution data — leads to new discoveries, and new avenues for research.
Project History
The project grew out of earlier research on Carolingian texts and the manuscripts that contain them. Although text-based treatments of early medieval networks are informative, a more nuanced understanding of the often complex relationships between individuals, texts, patrons, and readers become possible only when these early networks are visually displayed.
Carolingian Intellectual Networks has gone through many stages that have required different digital tools to complete. three digital tools to compile, organize, display and analyze the information:
- Stage one involved data collection and cleanup up, in which Microsoft Excel spreadsheets were used to compile, organize, and (when needed) append additional information fields to the data.
- Once the data was in tabular form, stage two involved exploring possible visualizations that could help find new patterns and discoveries in the data. Tableau software was used for the initial visualization because it can quickly ingest data from spreadsheets and help one see patterns in one's data through visualizations, such as graphs, scatter plots, and maps.
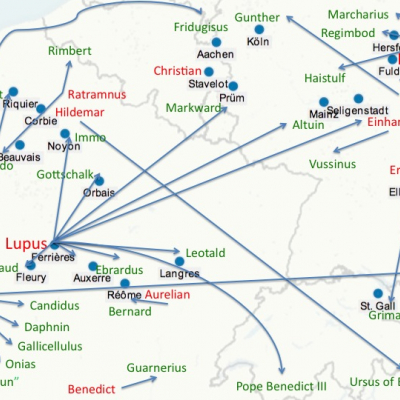
- Stage two helped undercover that network and geospatial visualizations would provide the most insight about the data. Stage three (the stage the project is currently in) focuses on exploring what information can be found in these network and geospatial representations. Gephi was initially used to create network graphs to see the relationships between written works, but the project has recently shifted to Nodegoat because of it's ability to combine geospatial and temporal information along side insights found in the network visualizations.
People Involved With The Project
- Clare Woods, Associate Professor Classical Studies (Primary Investigator)